
Campaign Reach on the FiveStars Merchant Dashboard

Background
FiveStars gives small business owners tools to reach their customers that are typically only available to larger businesses. This includes promotions, automated campaigns, and announcements. However, with federal TCPA laws requiring customers to opt in to receiving SMS messages, merchants would often send out campaigns into the void, unsure of how many were actually receiving campaigns.
Additionally, customers receive campaign messages according to a different priorities. For example, someone with the FiveStars mobile app will always receive push notifications, while those without the app (or notifications turned off) will fall down a level in our prioritization hierarchy and receive campaigns via SMS.

Showing messaging channel priorities on the merchant dashboard.
The Goal
For this project, my task was to design a solution for the FiveStars merchant dashboard that gives business owners this "campaigns reach" information at both the aggregate and customer level, while providing the context of our specific messaging channel priorities.

I designed icons to represent which messaging channels each customer can be reached through.
Tasks
Explore: Identify relevant information for merchants
First, I worked with the product and support teams to hone in on the most relevant information to expose to business owners on the merchant dashboard. Also, in order to design a solution that gives merchants the most relevant information, I needed to fully understand the slightly confusing messaging priorities myself.
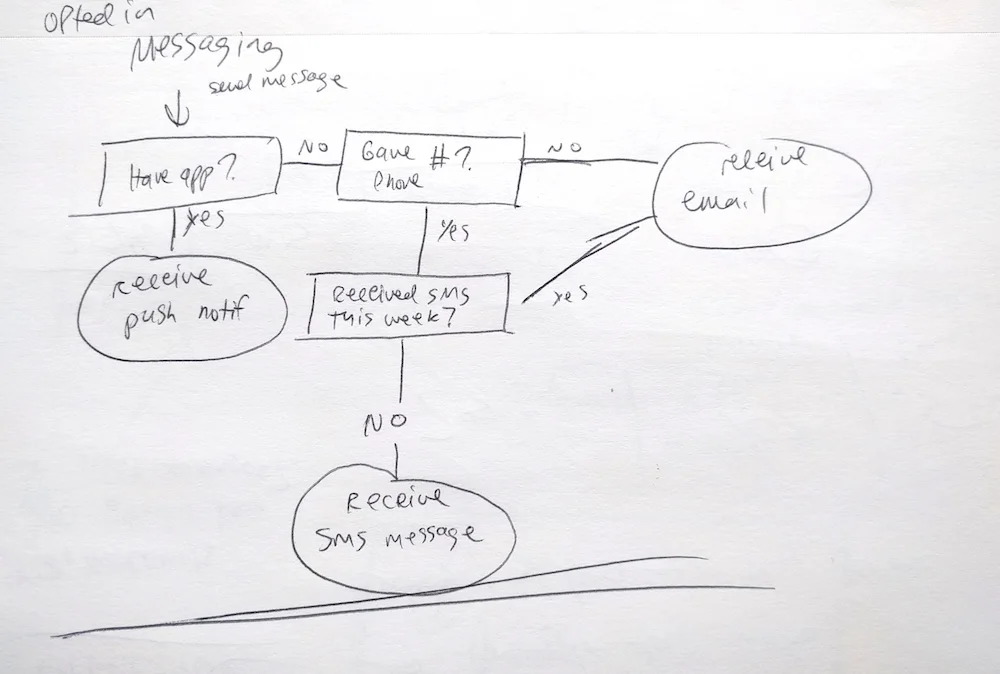
Mapping out the FiveStars messaging hierarchy.
Exploration: Research Data Visualization Strategies
I wanted to explore as many options as I could for representing the aggregate "reachability" data visually.
I found inspiration in charts of financial data, work from various data visualization agencies, and works of visual storytelling featuring interactive graphics like this and this.

Researching visual representations of proportions of a whole.
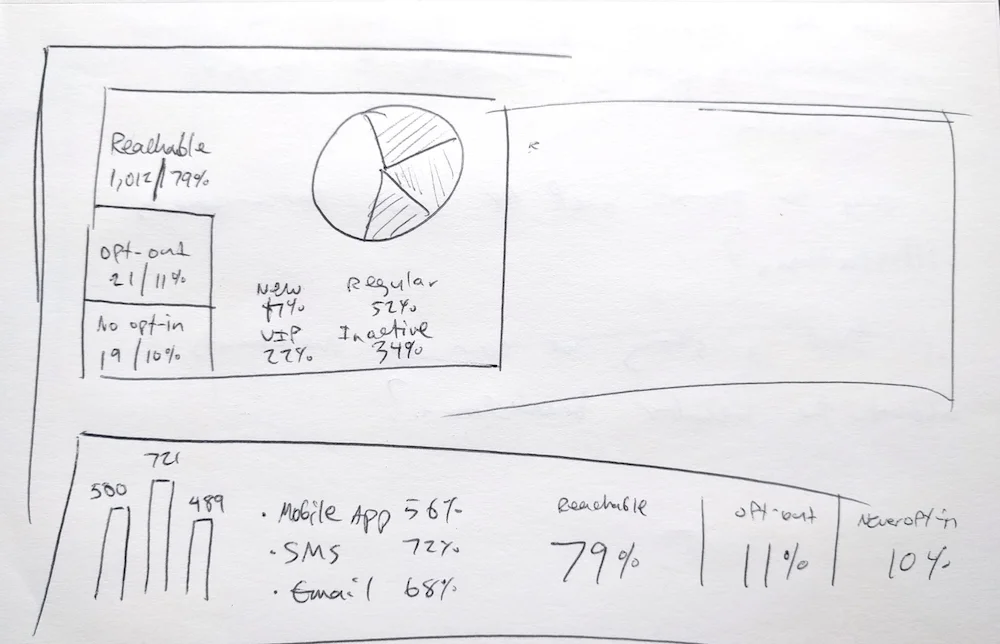
Sketching different options for showing "reachability" breakdown visually.
Design: Sketching, Feedback, Iteration
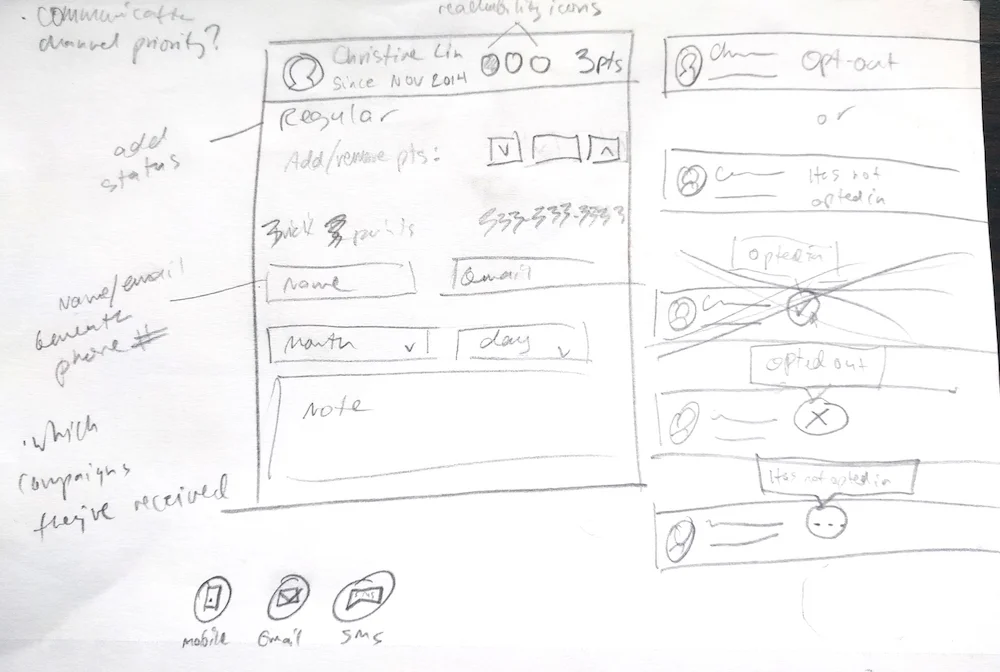
Sketching the customer profile view, bringing "reachability" information to the customer level.
I sketched out ideas and got feedback from product, design, and engineering. Iterated, worked on visuals, delivered high-fidelity designs.
Test and Deliver
Worked on copy and positioning with the support and marketing teams.
test understanding and copy with merchants
Used a paper prototype with merchants to test relevancy and understanding of concepts.
Support
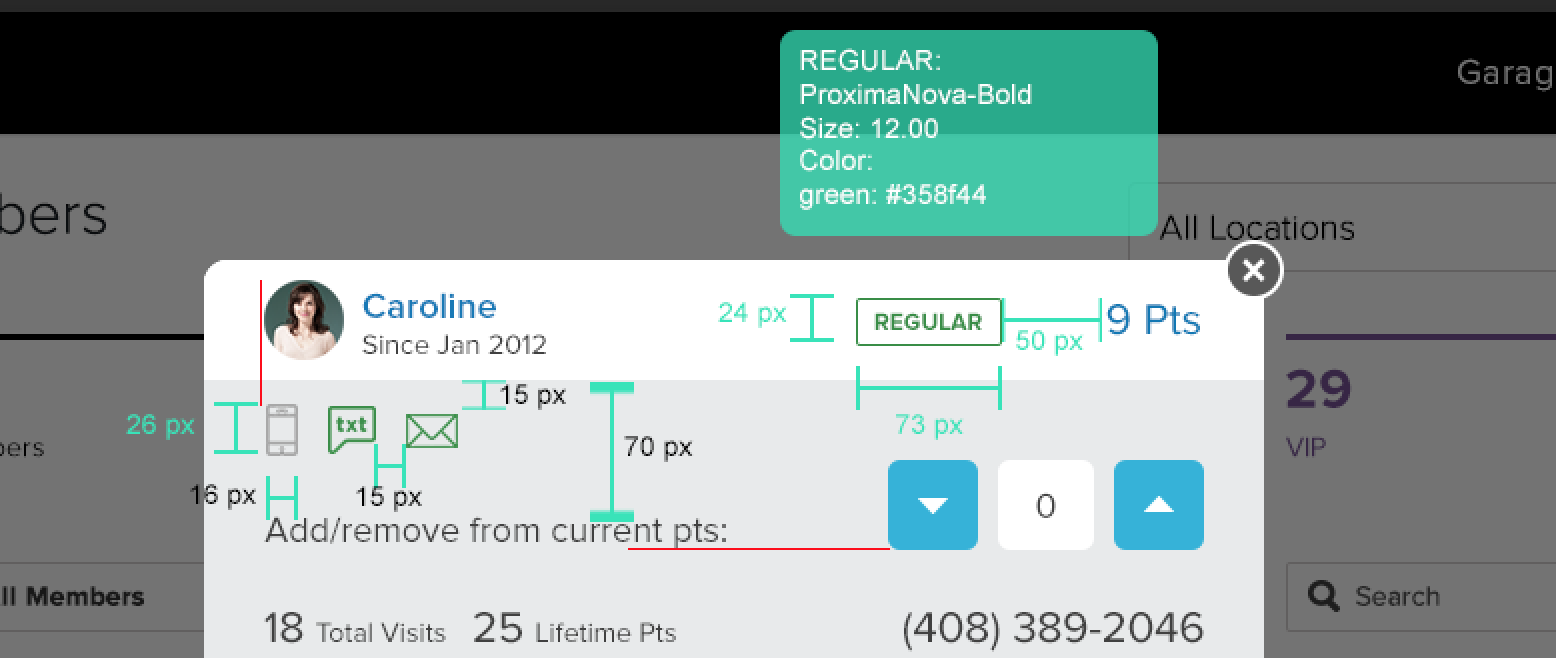
Specs I delivered for the redesigned customer profile.
I supported the dev team along the way with specs, visual edits, and product decisions.